Category: Uncategorized

  • 🔍 Understanding Ticker Symbols in Crypto: What Do X, 1000X, and XEmpire Mean?

    Everything you need to know about futures vs. spot ticker names and denominations in crypto


    🧠 TL;DR

    • Ticker names like BTC, BTC1000, or ETHXEmpire vary between spot and futures markets.
    • Numbers (e.g., 1000) usually denote contract denomination or multiplier.
    • Prefixes or suffixes can refer to leverage, platform branding, or product types.
    • Always verify the contract specs before trading — a BTC1000 contract is not the same as BTC!

    💱 Spot vs. Futures: The Basics

    🪙 Spot Market

    • You’re buying or selling the actual asset (e.g., BTC, ETH).
    • Ticker symbols are straightforward: BTC/USDT, ETH/USD, etc.
    • Price reflects real-time market demand.

    📈 Futures Market

    • You’re trading a derivative contract based on the future price of an asset.
    • Contracts can be linear (USDT-settled) or inverse (coin-settled).
    • Ticker names can get creative: BTC1000USD, XETH, XEmpireBTC.

    📘 Binance Futures Guide


    🔢 What Do Numbers Mean in Tickers Like BTC1000 or 1000CATS?

    💡 Denomination Explained

    • BTC1000 = Each contract represents 1/1000th of a BTC
    • ETH100 = 1/100 of an ETH per contract
    • 1000CATS = A contract for 1000 units of CATS token, not 1.

    🐱 Real Example: 1000CATS

    You may see exotic altcoin tickers like:

    • 1000CATSUSDT
    • 1000DOGE-PERP
    • 1000PEPEUSD

    This doesn’t mean the token is worth 1000 — it means the contract is denominated in 1000 units.

    Example:
    If CATS = $0.0023
    Then 1000CATS = $2.30 per contract

    This approach helps normalize low-priced assets and makes the contract size meaningful for trading.

    📘 Binance Futures Contract Multipliers


    🧬 Decoding Branding in Tickers: X, XEmpire & Others

    Some platforms or aggregators use custom ticker formats for various reasons:

    Prefix/Suffix Meaning
    X Often denotes derivatives or synthetic assets
    Empire, XEmpire Can indicate a platform-specific product or custom index
    1000, 500, Mini, Micro Denomination or leverage scaling

    These custom tickers usually appear on data platforms, aggregators, or non-standard DEXs.

    Example: XEmpireBTC might be a branded product from a DeFi project offering exotic BTC exposure.


    ⚠️ Watch Out: Ticker ≠ Always What You Think

    Don’t confuse similar-looking tickers!

    Ticker What It Actually Is
    BTC 1 full Bitcoin on spot
    BTC1000 1/1000 BTC contract on futures
    1000CATS Contract size = 1000 CATS tokens
    BTC-PERP Perpetual contract, often USDT- or USD-margined
    XBTC Synthetic BTC, possibly backed by oracles/liquidity pools
    XEmpireBTC Platform-defined derivative, check specs carefully!

    🔗 Always read the contract specifications on your platform!

    📘 Example: Bybit Contract Specs


    🏁 Conclusion

    Crypto ticker names can be confusing — especially with all the prefixes, multipliers, and branding involved in the futures market. But with a bit of understanding:

    • You’ll avoid costly mistakes 🧨
    • You’ll better manage your risk 🛡️
    • And you’ll know exactly what you’re trading ⚙️
  • 🚫 “No Coin on Spot”? Think Again! Understanding Duplicate Tickers in Crypto Trading

    Cryptocurrency traders often face a strange situation: they search for a coin on a spot exchange — and it’s “not there.” But how can that be, when you clearly saw the ticker somewhere else?

    Let’s break down this common confusion. Welcome to the world of duplicate tickers — where not all tokens with the same name are created equal.


    🔍 Same Ticker, Different Token? Here’s Why That Happens

    In traditional finance, ticker symbols like AAPL or GOOGL are unique and regulated. But in crypto? It’s a whole different story.

    Anyone can create a token and assign it any ticker — even if that ticker is already in use on another chain or exchange. This leads to multiple unrelated tokens using the same symbol, which causes confusion, especially for beginners.


    🧪 Case Study: TSTBSC on Binance Futures — But Nowhere on Spot?

    Imagine this situation:

    You open Binance, search for a token called TSTBSC — and see it on Binance Futures, fully tradable with USDT pairs, volume, and leverage.

    But when you switch to Spot Market: nothing. No listing. No chart. No trading pair.

    🤯 How is that possible?

    Here’s the catch: some tokens are listed exclusively on Futures, not on Spot.

    That’s exactly the case with TSTBSC — a ticker that resembles a real token but does not exist on Binance Spot. It only trades on Binance Futures, possibly via a synthetic listing (Binance sometimes creates synthetic markets based on price feeds, even for tokens that don’t exist on the native chain or in Binance custody).


    ⚠️ Why This Matters for Traders

    This has huge implications for both beginners and experienced traders:

    • You might be looking for the underlying asset, but it doesn’t exist on Binance at all.
    • Futures markets may be based on index prices or aggregated liquidity from external sources.
    • Traders assume spot liquidity exists and try to hedge — but get stuck with no way to settle or arbitrage.

    🧠 Real-world example:

    • You see TSTBSCUSDT on Binance Futures
    • You want to long spot, short futures — but you can’t, because there’s no spot listing
    • Result? Your hedge is broken ⚠️

    Binance’s own documentation clarifies that some perpetual contracts may not have corresponding spot markets. Always verify:

    • Is the Futures ticker linked to a real asset?
    • Is the asset available on-chain or only synthetically?

    📚 Learn more in Binance Futures Market Overview →


    🛡️ How to Protect Yourself

    Here’s what you should always check when trading a suspicious or unfamiliar ticker:

    Step What to Do Tools
    ✅ Check Spot Market Search token on Binance Spot or other CEXes Binance App or TradingView
    ✅ Verify on DEX Search the token contract on Uniswap/PancakeSwap DexScreener
    ✅ Confirm Contract Always use official contract from CoinGecko or CoinMarketCap CoinGecko
    ✅ Futures Only? Check if the token is only on derivatives markets Binance Futures

    💡 Summary: Don’t Trust Tickers at Face Value

    In crypto, a ticker symbol is just a name, not a unique ID. Always rely on contract addresses, not abbreviations.

    ✅ Before trading:

    • Check if the token is listed on Spot, DEX, or just Futures
    • Understand where the liquidity is
    • Never assume that Futures = real token availability

    🎯 If you’re a strategy trader (hedging, arbitrage, basis trading), this is critical to avoid mismatches.


    📈 Want to Go Deeper?

    Explore related topics:


    ✨ Final Thought

    The crypto world is fast, innovative — and sometimes misleading. But with the right knowledge, tools, and healthy skepticism, you can trade smarter.

    Next time someone says, “That token doesn’t exist on spot,” check twice — it might be a futures-only ghost ticker. 👻

  • 🚫 Stop Shorting the Pump! Crypto Risk Management Strategies That Save Your Capital


    🚀 Introduction: When the Market Makes No Sense

    The crypto market often puts traders in challenging situations—particularly during aggressive price surges that seem disconnected from fundamentals. This guide explores:

    • Why shorting in an uptrend can be a disaster
    • How to stay calm during sudden price pumps
    • Tactical responses to liquidation threats
    • Smart usage of averaging and hedging

    Understanding these principles can help you survive—and even thrive—during unpredictable market swings.


    ❌ The Perils of Shorting During an Uptrend

    🎯 Don’t Short “By Feel”—Wait for Trend Confirmation

    Shorting based on a gut feeling can be deadly. A coin like AERGO can continue pumping despite low inflows or weak fundamentals. This often leads to forced liquidations, not from your shorts—but from mass long closures!

    Golden rule: Never short until you see a clear trend break. Until then—observe, don’t act.

    🤯 When Charts Go Crazy: Recognizing Market “Nonsense”

    Ever looked at a chart and thought, “This defies logic”?

    • Price climbs while funding stays flat or negative
    • Volume disappears, but the price moonshots

    📸 Pro tip: Screenshot and ask in your trading community—“What’s happening here?” Don’t trade confusion; investigate it.


    🧠 Position Management: Averaging, Hedging & Exit Tactics

    ⚠️ When NOT to Average Down

    Averaging can be deadly if liquidation is close (<50% margin left). Doing this in an uptrend means you’re feeding a losing position.

    💣 Key takeaway: Averaging in a pump can wipe your account. Know your limits.

    🛡 When to Hedge (and When Not To)

    Hedging can protect your capital—but only if:

    • You place a strict stop-loss
    • You’re not just “throwing it on” during a panic

    🙅‍♂️ Hedging directly into a pump without strategy = false security.

    📌 Better move? Reduce or exit your position entirely instead of doubling down under stress.

    🔓 4 Smart Reactions to Liquidation Threats

    1. Close part—or all—of the position.
    2. Move stop-loss to breakeven.
    3. Hedge at resistance (only with a hard stop).
    4. Exit temporarily and watch the chart.

    📈 Trend or Range? Know What You’re Trading

    🔍 Where to Spot Trend Confirmation

    A true trend break is visible on all timeframes—from 15m up to daily. When a sideways chop turns into a sharp breakdown, it’s your short signal.

    🤖 Don’t Trust Indicators Blindly

    Indicators like SuperTrend may signal “Buy” even when the asset is overheating.

    👉 Example: AERGO showed bullish SuperTrend signals while metrics clearly showed exhaustion.

    💡 Price action + volume > indicators.


    📝 Building a Winning Watchlist & Entry Strategy

    📊 What Belongs on Your Watchlist?

    Curate your list with coins that:

    • Had recent pumps
    • Show unusual volatility
    • Appear in screeners (e.g., AVAI, AERGO)

    Constantly recheck the list for bounce-back setups or reversal signs.

    🎯 Ideal Entry Zones for Shorts

    Look to short when:

    • Price bounces after a dump, not at the top.
    • It hits known resistance levels.
    • Money exits during sideways movement, yet price fails to rise.

    📍 Example: AERGO post-pump + weak funding + flat spot = textbook short after confirmation (!!!).


    🧘‍♂️ Mastering Stress: Psychology of Trading Mistakes

    😱 Common Emotional Errors

    • Averaging down and hoping for a bounce
    • Refusing to close during liquidation threats
    • Panic trades from your phone (wrong order types, fat fingers)

    🧘‍♀️ Mental Framework for Calm Execution

    • Always trade from a PC
    • Accept mistakes—they’re your tuition fee
    • Predefine your max loss before entering

    🧘‍♂️ Mental reset tip: When under pressure, close the terminal, walk away, and return in 15 minutes. Emotion kills clarity.


    📌 Key Takeaways: Discipline > Prediction

    • ❌ Don’t short in an uptrend. Wait for breakdowns.
    • 🚫 Avoid averaging when close to liquidation.
    • 🛡 Hedge only with a plan and stop-loss.
    • 📋 Maintain and rotate your watchlist for the best entries.
    • 🧠 Stay focused—emotions are the enemy of strategy.

    💬 “Panic is the enemy of the trader. Success lies in system, discipline, and respect for risk.”


    🔗 Further Resources

  • 🚀 Understanding Market Reversals in Crypto Trading: How to Spot a Reliable Long Entry 📈

    When trading cryptocurrencies, spotting the right moment to enter a position is crucial to success. One of the most significant events traders look for is a market reversal, where the price trend changes direction. In this article, we will break down the key indicators of a potential long reversal and how to spot a confirmed entry on the chart.

    https://www.tradingview.com/x/WkTMSjmy/

    🔍 Current Market Situation: Analyzing AVAAIUSDT (April 19, 2025) ⏳

    On the 15-minute timeframe for the AVAAIUSDT pair, the market has shown some interesting price action. Let’s take a closer look at the situation:

    • Previous Trend: The coin has been in a clear downtrend, with lower highs and lower lows.
    • Recent Price Action: A local upward impulse has recently broken the previous local high.

    While this price movement shows potential, it’s still not a fully confirmed reversal into a long position. Let’s dive deeper into what needs to happen for a reversal to be considered confirmed.

    🔑 Key Conditions for a Confirmed Long Reversal

    To enter a long position with confidence, we need to see a well-structured reversal pattern. Here’s the process step-by-step:

    1. Upward Impulse: The first upward move has already occurred, as seen in the chart.
    2. Downward Correction: After the impulse, the price should retrace downward but should not break the previous low. A higher low must form.
    3. Second Upward Impulse: The final confirmation comes when the price breaks the previous local high after the correction.

    Only when these conditions are met can we confidently say that a confirmed reversal has occurred, signaling a good time to enter a long position.

    🧑‍🏫 Conclusion: Is It Time to Go Long?

    As of now, we’re only seeing the first upward impulse. Here’s the breakdown:

    • What’s missing: A correction followed by a higher low, and then a break above the previous high.
    • Current state: It’s still too early to enter a long position.

    📅 Recommendation: Wait for Confirmation

    Traders should hold off on entering a long position until the following conditions are met:

    1. Wait for a correction: Observe the formation of a higher low.
    2. Look for a break above the local high: This confirms the bullish momentum.
    3. Enter cautiously once the full reversal pattern is confirmed.

    By being patient and waiting for the market to confirm a reversal, you increase your chances of entering a successful trade.

    🎯 Summary: Timing Your Trades for Maximum Profit 💰

    In conclusion, while the first signs of a reversal are visible on the AVAAIUSDT chart, it’s important to wait for the price structure to complete before making a move. By following the steps outlined above, you’ll be better equipped to spot a confirmed long entry.

    Remember: In crypto trading, patience and precision are key!

    Stay tuned for more trading tips and updates, and make sure to check out our other resources for deeper insights into market analysis and strategies.

  • 🧠 Outsmarting the Herd: Mastering Market Setups in Crypto Trading

    The key to consistent profitability in crypto trading isn’t chasing hype — it’s understanding setups, following strict risk management, and avoiding the emotional traps of crowd behavior. In this article, we explore proven strategies, beginner pitfalls, and how to survive and thrive in the volatile world of crypto.


    🛠️ Beating the “Hamster Hustle”

    “Have a setup — trade it. No setup — stay out.”

    Too many traders jump into the market with no plan, reacting to price instead of anticipating it. Let’s flip that script.

    🎯 The Power of Setups

    Setups are structured, repeatable conditions that guide your entries and exits. They are your trading edge. Without them, you’re just gambling.

    Common crypto trading setups:

    • Long Setup: Volume surge + liquidations = start of a pump
      Example: sudden spike in open interest + cascading shorts = opportunity for long.
    • Short Setup: Trend continuation short after a bounce
      When money starts flowing out and price retraces — time to join the downtrend.

    📊 Typical Playbook Scenarios

    Long trade patterns:

    • Enter near the bottom after liquidation events.
    • Confirmed by a 2x–3x volume spike.

    Short trade patterns:

    • Enter after a bounce during a downtrend.
    • Look for signs of capital outflow and weakening support.

    Visual example:
    Chart showing liquidation-driven bounce and volume breakout.

    https://cdn.coinglasscdn.com/snapshot/d2161f9286854a10acc2e6a4d754bd47.png

    ❌ Common Rookie Mistakes

    • Chasing green candles: Entering pumps after the move is over.
    • Trading without market structure awareness: Not knowing where you are in the cycle.
    • Random entries on hype.
    • Averaging down without a plan: AKA “hope strategy.”
    • No stop losses: Leading to huge drawdowns.

    💡 Pro Tip: Plan your exit before you enter.


    🚨 The Danger of Hype & “The Crowd”

    🧠 Crowd Psychology 101

    The crowd often gets it wrong — they rush into trending coins with no plan, driven by FOMO.

    Symptoms of crowd-driven mistakes:

    • Mass buying into hype coins (e.g., meme tokens or AI coins).
    • No risk management or exit plan.
    • Emotional rollercoaster: euphoria → crash → regret.

    📖 Related reading: The Madness of Crowds

    Golden Rule:

    Don’t trade what everyone else is trading — by the time it’s trending, the edge is gone.

    🧨 Pump & Scam Examples

    Remember the $TRUMP token hype?

    • Massive retail inflow → sharp pump.
    • Whales dump → instant crash.
    • Thousands liquidated.

    Lesson: High marketing ≠ long-term value.
    Avoid coins that trend only due to social media buzz.

    🎥 Watch: How Pump and Dumps Work

    💥 Listing Mistakes to Avoid

    New coin listings? They can be profitable, but most beginners get wrecked.

    Classic listing mistakes:

    • Buying on rumors with no data.
    • No understanding of risk management (RM).
    • No strategy for drawdowns or exits.

    🔥 Pro Tip: Wait for the first sell-off. The second wave is often more stable.


    🧭 Final Thoughts: Discipline Is the Edge

    Successful trading isn’t about being right — it’s about following your strategy with precision.

    Stick to your setups
    Ignore the hype
    Use risk management every time
    Document your trades and improve iteratively

    🎯 Tools like grid strategies, liquidation heatmaps, and volume analysis work only when applied with discipline and experience.

    📘 Bonus resource: Crypto Trading Strategies: A Complete Guide (CoinGecko)

  • 💥 The Luce Coin Crash: From Holy Hype to Meme Meltdown

    🚨 What Happened to Luce?

    Luce (LUCE), once a rising star in the meme coin universe, has experienced a dramatic downfall. After peaking at $0.08, LUCE plummeted by 25% in just 24 hours, settling at $0.04487. This sharp decline occurred amidst a broader cryptocurrency market downturn, with major coins like Bitcoin and Ethereum also suffering significant losses. ​InsideBitcoins.com, CryptoRank

    https://www.tradingview.com/x/i8zq5f4N


    🧸 The Origins of Luce

    Launched in late 2024, Luce was inspired by the Vatican’s Jubilee of Hope 2025 mascot, aiming to blend cultural significance with the viral appeal of meme coins. Its unique branding and initial surge attracted a wave of investors seeking the next big thing in the crypto space.​

    https://en.wikipedia.org/wiki/Luce_(mascot)


    📉 Market Dynamics and the Broader Crypto Crash

    The recent crash of Luce coincided with a significant downturn in the overall cryptocurrency market. Factors contributing to this include:​

    • Global Economic Tensions: New tariffs imposed by former President Trump on countries like China, Canada, and Mexico have sparked fears of a trade war, leading to market instability.​ Thecoinacademy.co
    • Federal Reserve Policies: Hawkish projections from the U.S. Federal Reserve regarding inflation and interest rates have led to a $1.25 billion liquidation in the crypto markets. ​Coin Edition
    • Market Manipulation Concerns: Accusations have surfaced against major players like Wintermute and Binance for allegedly orchestrating price collapses to accumulate assets at lower prices. ​Coin Academy

    🔍 Technical Analysis: Is There Hope for Recovery?

    Despite the downturn, some technical indicators suggest a potential for rebound:​

    • Support Levels: LUCE is hovering near a support level around $0.045, which could act as a foundation for a price recovery. insidebitcoins.com
    • MACD Indicator: The Moving Average Convergence Divergence (MACD) shows signs of weakening bearish momentum, hinting at a possible reversal. ​InsideBitcoins.com
    • Relative Strength Index (RSI): With an RSI close to the oversold level, there’s potential for increased buying interest if bullish momentum builds. ​InsideBitcoins.com

    ⚠️ Lessons Learned: Avoiding the Meme Coin Trap

    The Luce debacle underscores the risks associated with investing in meme coins:

    • Erratic Price Behavior: Unpredictable price movements and lack of response to market news can be red flags.​
    • Liquidity Issues: Disappearing buy/sell walls and lack of accumulation patterns suggest potential manipulation.​
    • Community Warnings: Traders flagged Luce as a scam token due to its erratic behavior and lack of structured liquidity .​

    🛡️ Protecting Yourself in the Crypto Market

    To safeguard your investments:

    • Conduct Thorough Research: Investigate the project’s fundamentals, team, and community feedback.​
    • Utilize Analytical Tools: Platforms like DexTools, CoinMarketCap, and TokenSniffer can provide valuable insights.​
    • Stay Informed: Keep abreast of market news and be wary of hype-driven investments.​

    📚 Further Reading

  • 🎯 Precision Trading: Mastering the Grid Strategy for Crypto Position Building

    Mastering the Grid Strategy in Crypto Trading (2025 Edition)
    Discover the pros, cons, and technical setup of the crypto grid strategy for position building. Learn when and how to use it to boost your trading edge.


    🧩 What Is a Grid Strategy in Crypto Trading?

    In crypto trading, the grid strategy refers to placing multiple buy (or sell) orders at incrementally lower (or higher) price levels around a central point. This technique helps traders build a position more flexibly, especially during volatile or uncertain market conditions.

    Used wisely, a grid can turn market chaos into calculated opportunity. Used poorly… well, that’s when things go south fast.


    ✅ Pros & ❌ Cons of the Grid Strategy

    ✔️ Advantages

    • Smarter entries: Averaging into a position when the price deviates temporarily from your forecasted trend.
    • Short-term recovery potential: Increased chance of turning a profit during short-term price spikes or liquidation squeezes.
    • Emotional buffer: Reduces the stress of nailing the perfect entry point — because you’re entering in chunks.

    ⚠️ Disadvantages

    • Risk amplification: If your bias is wrong, you’re compounding losses.
    • Strict discipline required: Without solid risk management and predefined stop-losses, you’re exposed.
    • Not one-size-fits-all: Success heavily depends on the trader’s skill, market conditions, and timing.

    “Grid trading can turn a choppy market into a trader’s playground — but only if you bring your safety net.” — Veteran Crypto Trader


    🔧 How to Build a Local Grid (With Real-World Context)

    The “local grid” refers to a price range — typically 5–15% below your initial entry — where you place layered buy orders. This grid acts as a buffer zone, allowing you to build your position gradually.

    💡 When to Use It

    • After liquidations: When the market overreacts and dumps due to mass liquidations.
    • During sideways movement: In a consolidation phase (“range”), grid orders let you play both sides.
    • In anticipation of a short squeeze: If indicators suggest an imminent reversal due to short positions being trapped.

    📈 Case Study

    Let’s say a major liquidation event occurs in a downtrend. You spot it and believe a reversal or bounce is likely.

    Tactical move:

    1. Set initial buy order at your identified point.
    2. Deploy grid orders at -5%, -8%, -12%, and -15% levels.
    3. Manage your risk per entry and total exposure.
    4. Exit into the expected rebound or trail your stops.

    This layered approach can increase your reward without going all-in at a single point of failure.


    🧪 Real Market Use: Then vs. Now

    📈 Bull Market Era

    Back when Bitcoin was mooning and DeFi tokens were surging, traders used long-only grids. The assumption? “Any dip is a gift.”

    It worked — until it didn’t.

    🧠 Smarter in 2025

    Today’s market demands finesse. The modern grid strategy is more tactical:

    • Used sparingly.
    • Focused on post-liquidation zones.
    • Combined with analysis of capital outflows, order book depth, and volume traps.

    By leveraging liquidation maps and whale tracker data (e.g., Coinglass), traders can better time grid entries based on real-time market pressure.


    🔍 Final Thoughts: Is Grid Trading for You?

    Grid strategies offer structured flexibility — but they aren’t for the faint of heart. This method demands:

    • Patience 🧘
    • Precision 🎯
    • Position sizing discipline 📊

    Before going live, backtest your grid strategy, understand your maximum drawdown, and always set predefined invalidation points.

    Pro tip: Combine your grid with on-chain data, liquidation heatmaps, and volume clusters for an edge most retail traders don’t use.


    📚 Further Reading & Tools

  • 🚨 Scam Coins Alert Apr 2025: Why Maneki, Luce, and Buzz Should Be Avoided

    🧩 Summary

    In April 2025, three coins — Maneki, Luce, and Buzz — were officially removed from traders’ watchlists after being labeled as scam tokens. Community experts pointed to erratic price behavior, lack of structured liquidity, and vanishing market makers. This article explores how to spot these red flags early and avoid losing capital in scam-driven markets.


    🔹 Maneki, Luce, Buzz — A Case Study in Scam Behavior

    🚫 Why these coins are no longer tradable

    • Unanalyzable charts: full of noise, unpredictable wicks, and no reaction to news or volume.
    • Disappearing liquidity: no sustainable buy/sell walls, no accumulation patterns.
    • Community consensus: flagged by traders on CryptoQuant and X/Twitter.

    “These charts are noise, not signals. Trading them is gambling.”
    — Community Analyst, April 2025

    🔒 Final Recommendation

    Avoid these assets completely. Do not attempt technical analysis or entries — it’s a trap.


    🔹 How to Identify a Scam Coin by Its Chart

    📉 1. Choppy Charts

    Choppy chart example 
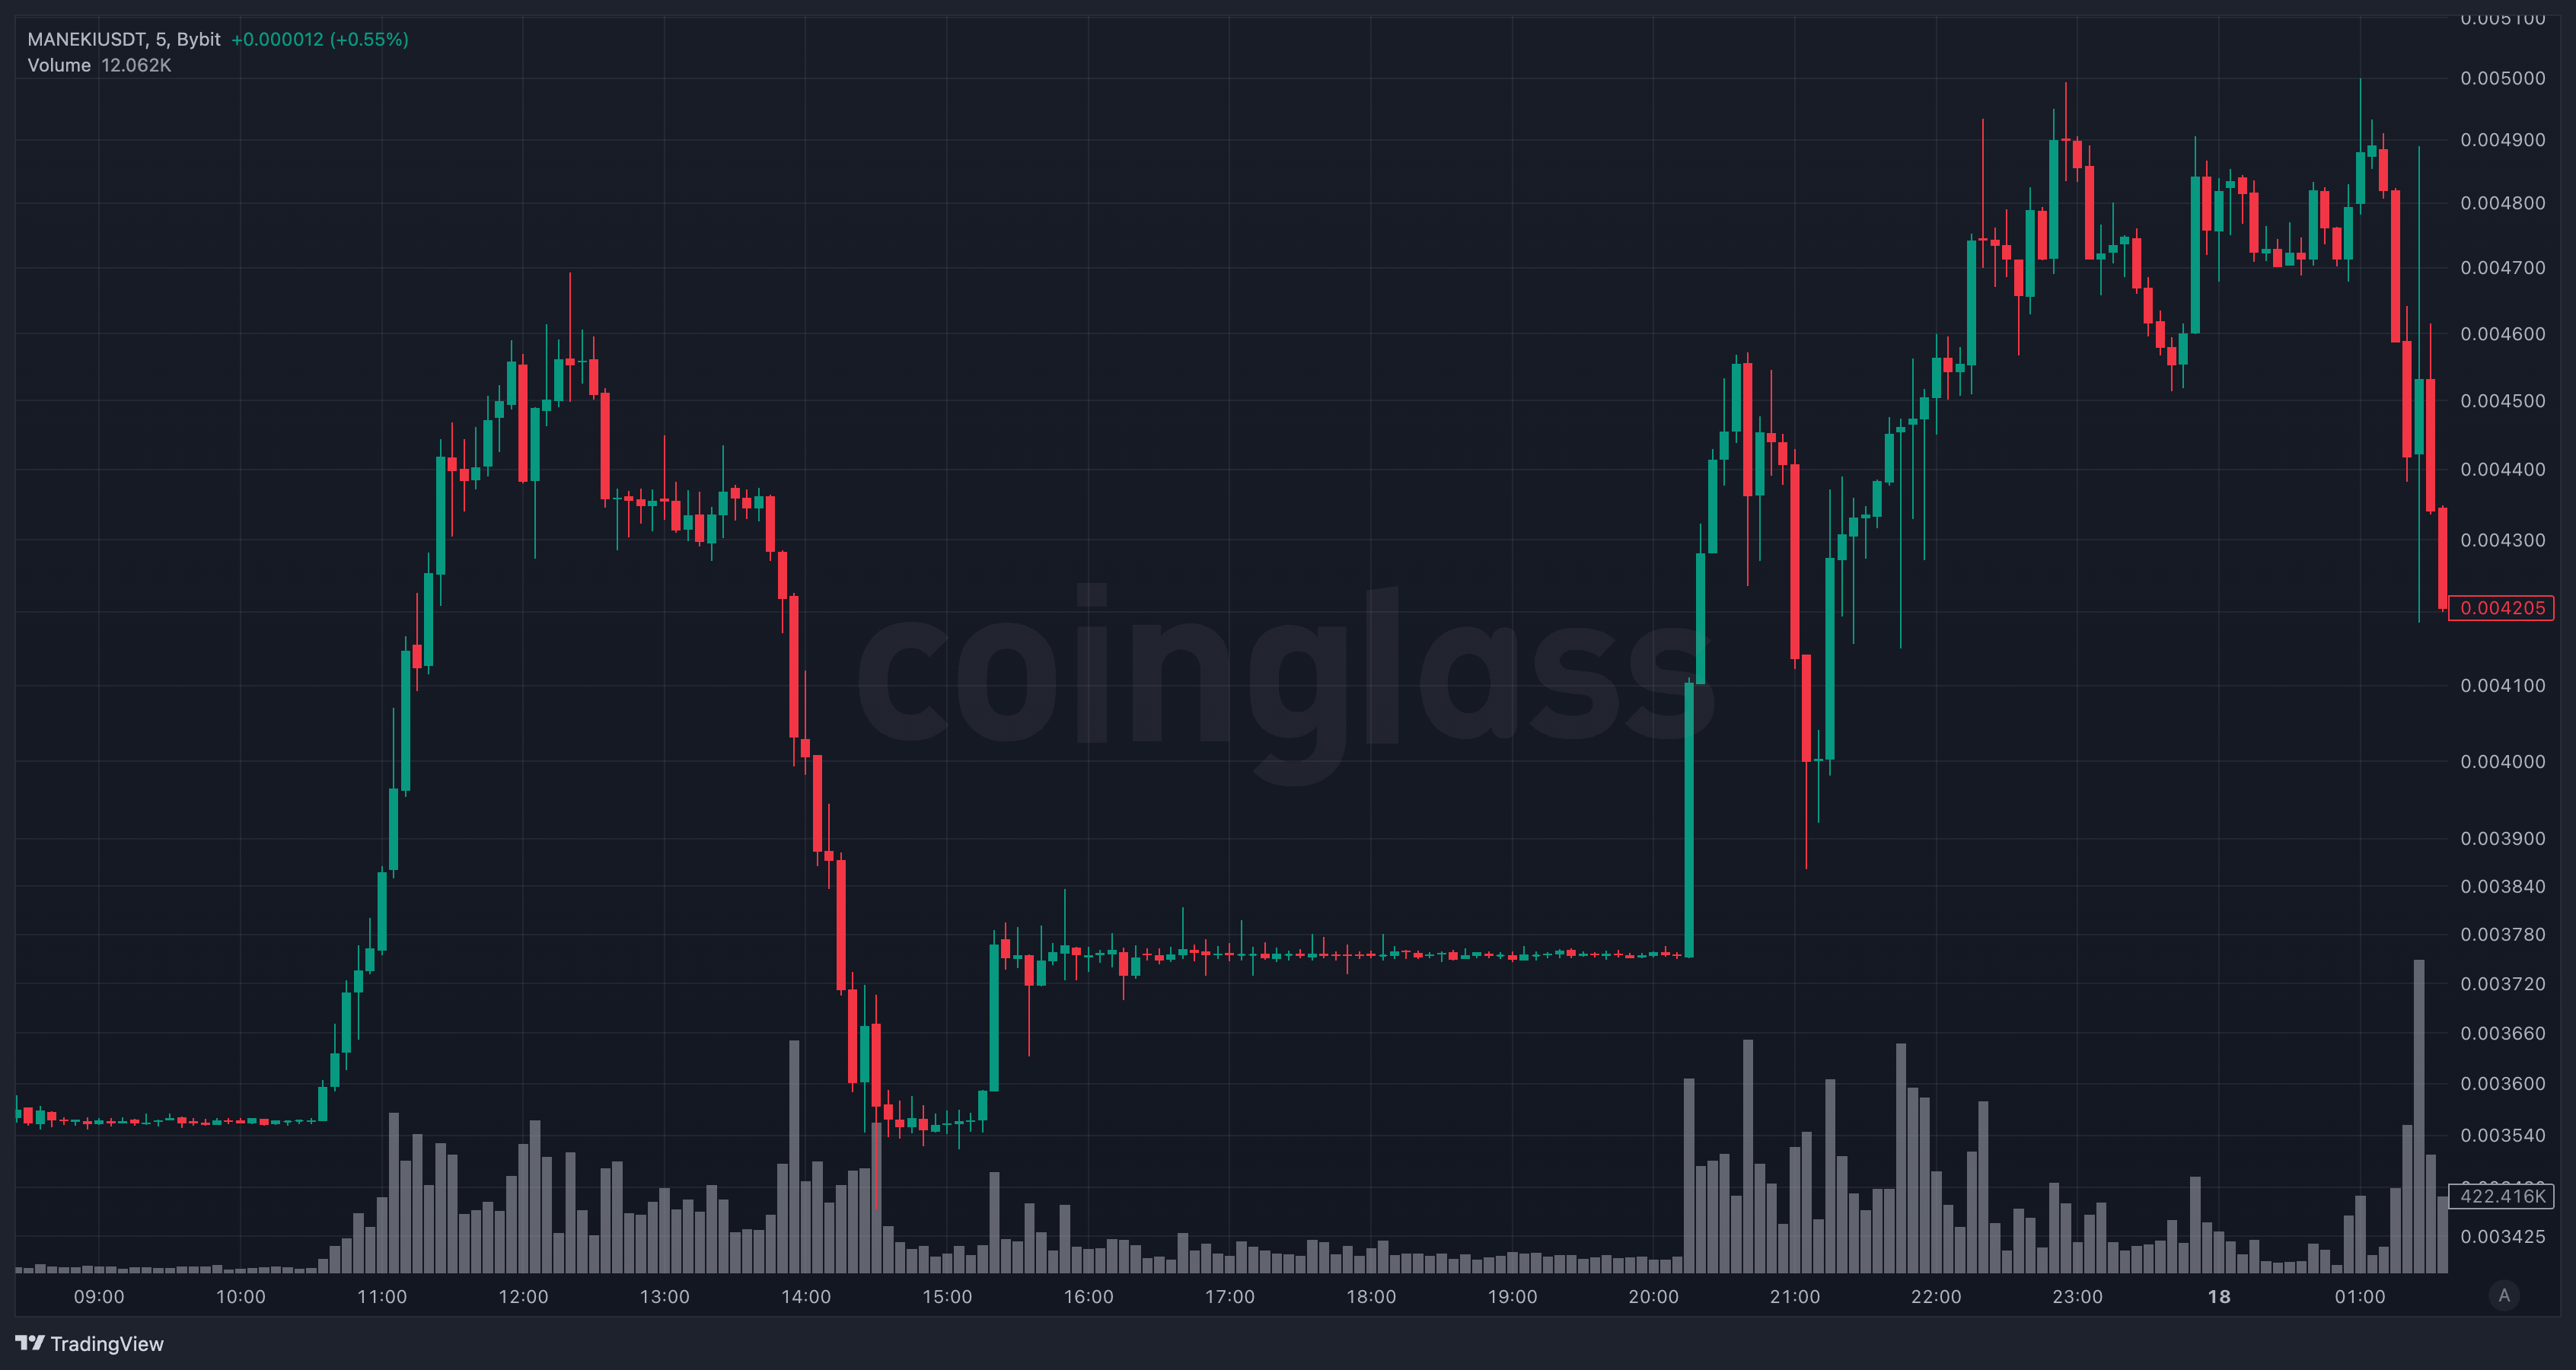
Maneki/USDT, 15-minute timeframe.

    • Price moves aimlessly within narrow ranges.
    • No breakouts, no trend, no confirmation candles.
    • Common in coins with fake volume and no genuine interest.

    ⚡ 2. Convulsions and Spikes

    Random spikes and dumps
    Buzz/USDT, showing impulsive wicks.

    • Sudden +15% pumps followed by -15% dumps within minutes.
    • Caused by bots or one-wallet manipulation.
    • Not tradeable with stop-loss logic.

    👻 3. The “Ghost” Market Maker

    • Temporary walls appear, then vanish in seconds.
    • No resistance/support zones are maintained.
    • Order book looks artificial or empty — seen before LFT and Jelly collapsed.

    🔍 Tools for Verifying Coin Legitimacy

    Tool Use
    DexTools DeFi scanner and pair analysis
    CoinMarketCap Tokenomics, audit history, supply
    TokenSniffer Contract red flag detector
    Arkham Intelligence Wallet tracing and entity analysis
    Lookonchain On-chain forensic reports

    These tools can help you determine if a coin is worth investigating or should be blacklisted immediately.


    📚 Conclusion: Safety First in Crypto Trading

    Scam coins aren’t just low-potential projects — they’re engineered traps. Maneki, Luce, and Buzz illustrate the common pattern:

    • Disappear when questioned
    • Pump once, then stagnate
    • Appear in pump groups or low-volume exchanges

    “Better to miss an opportunity than fall into a scam.”

    Protect your capital. Trade assets that respect your risk model.


    🔖 Related Reads